

Profit in peril? Correctly valuing Baseload PPAs in the Nordic market
Onshore wind has been one of the most exciting areas in the Nordics with lots of M&A activity. One important catalyst for the increase in RES investments is the concept of PPA – Power Purchasing Agreements.
These bilateral agreements between a RES generator and an offtaker (corporate or utility) provide predictable and hedged revenues, thus reducing the investment risk for lenders and equity investors. Consequently, evaluating a PPA is central in a commercial due diligence: to correctly understand risks, estimate revenues and reflect those in the financial model valuation.
Having undertaken this exercise for several Nordic transactions, we have observed multiple times that quantification of project revenues under a Baseload PPA is misunderstood and wrongly calculated. Focus usually falls on the PPA revenues and the complexity of valuing the residual non-PPA volumes, which are exposed to profile risk, is often overlooked. This can trigger long arguments between parties and leads to erroneous results for project valuation and debt sizing, complicating an already intense M&A process.
In this piece we aim to bring some transparency on this issue and highlight that:
- In a Baseload PPA, using capture prices as the proxy for the residual non-PPA volumes is wrong and leads to overstated revenues
- The correct approach should account for the hourly prices and hourly generation for the modelled future years
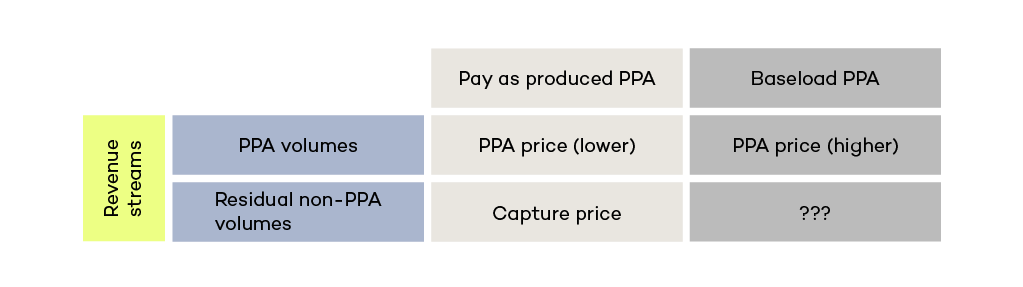
Figure 1: Price proxy for different PPA revenue streams
Revenues from electricity sales are a key component in the financial model valuation
Two types of data are of relevance when calculating electricity sales revenues: generation and market prices. The expected annual generation, usually expressed by the P50 energy yield assessment, is provided by technical advisors and gives an estimate of the amount of electricity produced in an average year. Market price projections from a third-party provider give a view of the future electricity prices, at a wholesale level and capture price. In a transaction, it is usually recommended that the asset specific capture price analysis is performed which provides a view on revenue cannibalisation for the specific wind park.
Electricity sales are by far the largest source of revenue and one of the key components in the financial model. With a PPA in place, modelled income is divided in PPA revenues – the portion of the sales covered by the PPA arrangement, and residual non-PPA revenues – the remaining volumes that are exposed to the market price. The calculation of the former is relatively straightforward, as both the volume and the price should be defined by the PPA terms. The rest of this article covers the residual non-PPA revenues.
A pay-as-produced PPA distributes volumes proportionally and capture prices are a valid proxy for the residual non-PPA volumes
When discussing PPAs it is important to differentiate between pay-as-produced PPAs and Baseload PPAs. A pay-as-produced PPA is rather straightforward for the project owner who will receive a fixed price for every unit of energy produced by the wind park. When the PPA covers only part of the generation volume, usually expressed as percentage or MW, the generation volume for each hour of operation will be split accordingly between the PPA offtaker and residual non-PPA revenues (sold at spot).
At an annual level, the residual non-PPA revenues can be calculated by applying the asset capture prices to the residual non-PPA volumes. Whether the pay-as-produced PPA covers 10% or 90% of the hourly generation, the cannibalisation will correctly be reflected by simply applying the capture price.
A Baseload PPA has a fundamentally different risk
The Baseload PPAs have been growing in popularity, with increased demand from offtakers less willing to be exposed to the volatility of wind generation. The key differentiating element for a Baseload PPA is that the volume is expressed as a fixed amount of energy (MWh per hour) that will be delivered in every hour of the year. The annual volume of Baseload PPA can be expressed as a percentage of the generation P50 volumes (e.g. fixed MWh per hour x 24 h x 365). The wind park will sell at spot the surplus generation in the high wind hours and purchase the shortfall for the PPA delivery obligation in the low wind hours.
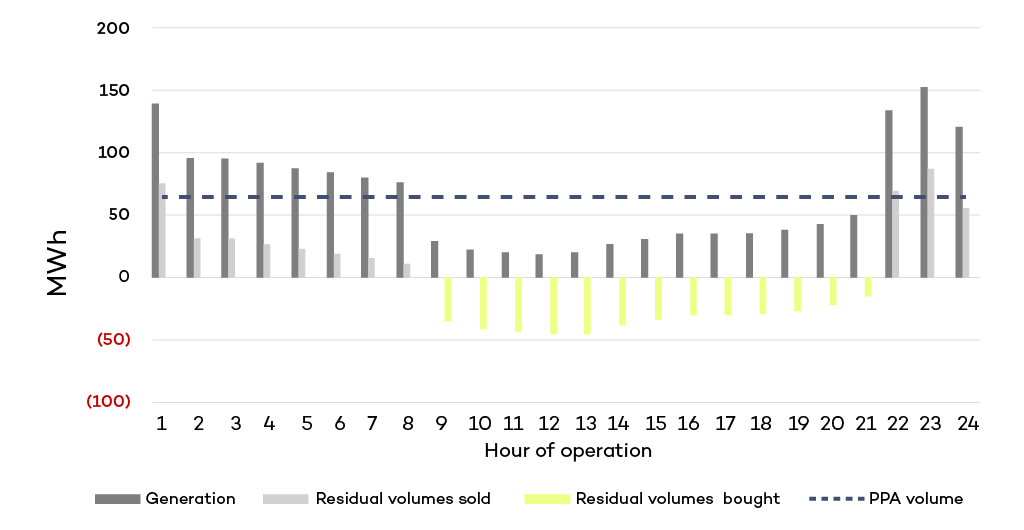
Figure 2: Illustration of the hourly residual non-PPA volumes for a Baseload PPA.
In the low wind hours (9-21 in this case) the wind park needs to purchase electricity from the market for the PPA delivery obligation
To exemplify, a fictional 200MW wind park with 40% load factor would have an expected generation of 702 GWh. A Baseload PPA with a fixed 65 MWh/h baseload delivery would amount to an annual volume of 569 GWh, or 81% of the total. The net residual non-PPA volumes would represent 132 GWh. Given the wind profile from our example, the 132 GWh would be deconstructed into 349 GWh sold and 217 GWh shortfall bought in the market. See the attached excel for the sample data and calculation.
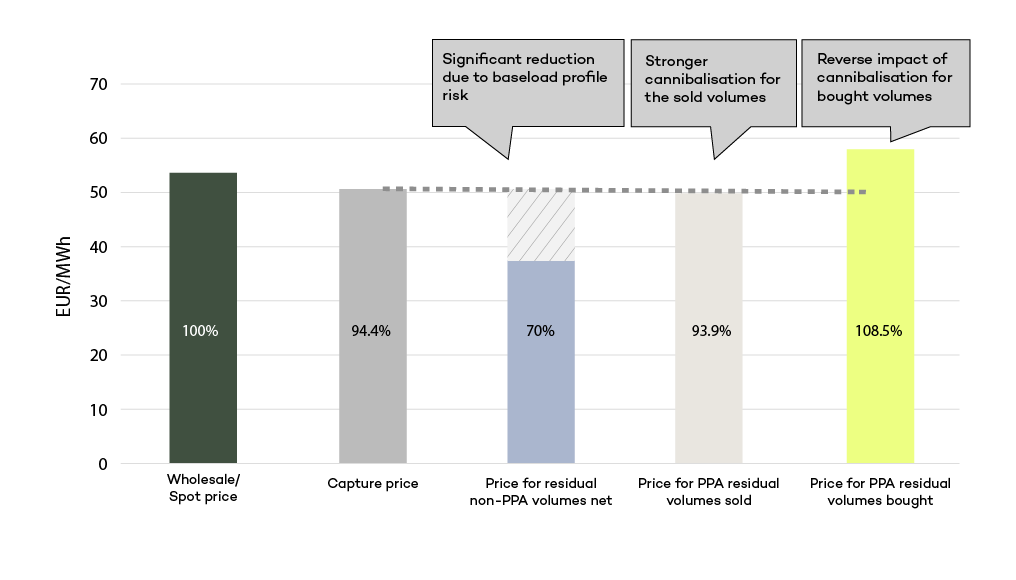
Figure 3: Illustration of the average price for the residual non-PPA volumes in a Baseload PPA
In this example, a fully merchant project would capture 94.4% of the wholesale price. In the presence of a Baseload PPA, the residual non-PPA volumes would capture a significantly lower average price of only 70% of wholesale price
Under a Baseload PPA, using capture price as a proxy is wrong and can lead to significant overstating of revenues
The first takeaway is that in the case of a Baseload PPA one cannot simply use capture prices as a proxy for the residual non-PPA volumes. The fact that spot prices tend to be higher in the low wind hours will amplify the cannibalisation effect. As a result, the residual non-PPA volumes will embed the cost of balancing the wind intermittency (profile risk) which is also the reason why Baseload PPA prices are higher than compared to pay-as-produced.
In the attached spreadsheet we illustrate this with one year of hourly generation and price sample data for the fictional 200MW wind park. After calculating the hourly residual non-PPA volume and revenue, we sum the total for the year and analyse the average price for each category. The example shows that if the standard capture price ratio is at 94.4% of the average spot, the average price for the net residual non-PPA volumes is significantly lower, at 70% of the average wholesale price. While the average price for the sold volumes is only slightly lower than capture price (93.9% vs 94.4%), the average cost for the bought volumes is 108.5% and affects negatively the net result.
If in our example one were to mistakenly use the capture price as proxy for the residual volumes on an aggregate level, the revenues would be artificially inflated by 1.7 mEUR per year, which represents 35% of the net residual revenues or 7% of the total project revenues.
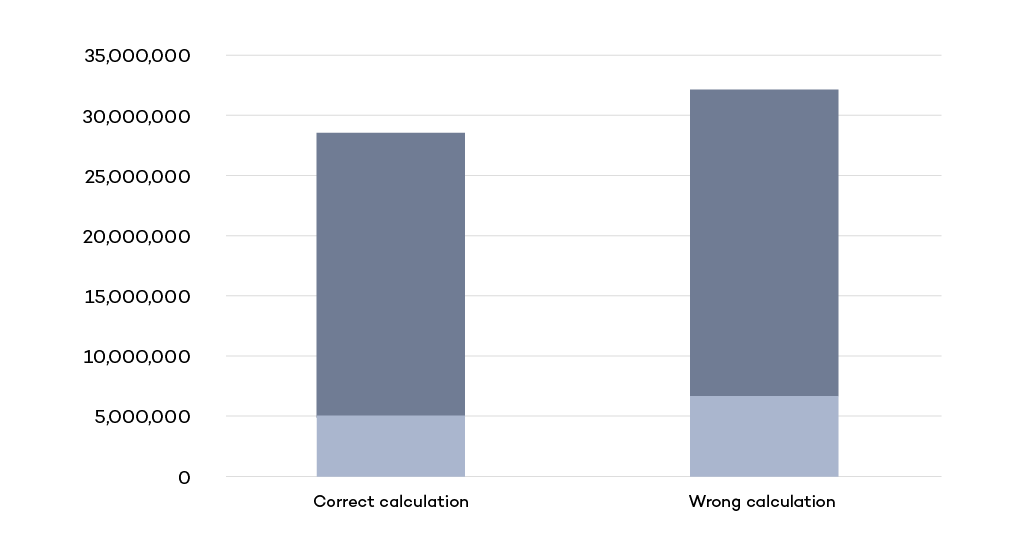
Figure 4: The impact of a wrong calculation approach of using capture prices is significant
By using mistakenly the capture price as proxy for the non-PPA residual volumes, revenues would be artificially inflated by 1.7 mEUR per year
The stepwise approach for modelling a Baseload PPA requires consistent hourly data for prices and generation
This brings us to the second takeaway: to avoid these overestimations, the correct approach should account for the hourly prices and hourly generation for the modelled future years. The steps of the analysis are similar to what is shown in the excel example, with the real difficulty being in producing consistent hourly generation and price data:
- Produce hourly profile for the wind asset, consistent with the P50 yield analysis (also used in the capture price analysis)
- Combine them with consistent hourly price projection data for the relevant price areas, reflecting the future energy market assumptions and changes in capacity mix
- Ideally both of the above would be performed for several weather years, since Nordic weather has a major impact on the end result
- Model the Baseload PPA revenues and especially residual non-PPA volumes and how cannibalisation affects them.
AFRY has done this type of analysis multiple times using hourly data from the BID3 market model and generating consistent asset specific generation profiles. The shown example and the discussion above describe the simplest type of Baseload PPA with a flat baseload level throughout the year. It should be noted that for such a Baseload PPA it is mathematically possible to calculate the residual non-PPA revenues without the hourly modelling.
The analysis would then be based on annual figures and would depend on a capture price that correctly and consistently reflects wind cannibalisation of the asset. The limitation of such an analysis would be the lack of understanding of further details (bought volumes and their price, cash flow implications, etc.) as well as inability to be applied to more complex PPAs (price ladder, floor and ceiling etc).

For further information, please contact Kathrine Stene Bakke or Sergiu Maznic.